
An Online Visualization Tool for 3D polyhedra using Sage
Visualizing 3D polyhedra
How does it Work?
This page uses SageMath for visualization. SageMath is a free open-source mathematics software system licensed under the GPL. The SageMathCell project is an easy-to-use web interface to SageMath. It allows embedding Sage computations into any webpage. Resources for your computation are provided by SageMath, Inc..
This tool calls the Polyhedron class to define your polyhedron.
The argument ieqs is a vector of vectors \( [d, a, b, c] \) to
indicate constraint \( ax_1 + bx_2 + cx_3 + d \ge 0 \). Then,
plot is called on that object. For instance, the following Sage
command will plot \( X \) defined below.
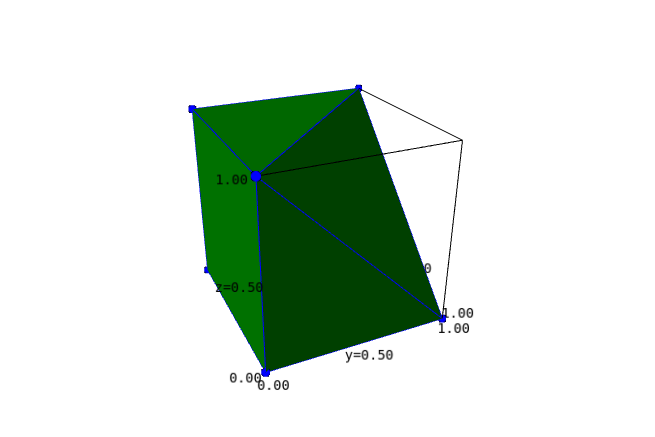
For instance, to draw the polytope $$ \left\{ x\in\mathbb R^3 : \ \begin{array}{ll} x_1 + x_2 + x_3 \le 2, \\ x_1 \le 1, \\ x_2 \le 1, \\ x_3 \le 1, \\ x_1 \ge 0, \\ x_2 \ge 0, \\ x_4 \ge 0, \end{array} \right\}, $$ one should run the following command.
Polyhedron(ieqs = [[2,-1,-1,-1],[0,1,0,0],[0,0,1,0],[0,0,0,1],[1,-1,0,0],[1,0,-1,0],[1,0,0,-1]]).plot()